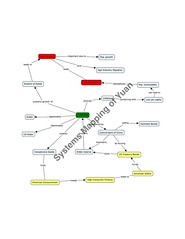
Systems Mapping of Yuan, Again
In the past I wrote about my course - CMP - where the first part of the course concentrated on this model of thinking called "systems thinking".
In order to get to understand the concepts better I had created a "map of the yuan peg" showing the direction of change and the effect it was having on many factors.
However, the map created using MS Word was not satisfactory.
I found this wonderful application today called the "CMAP Tools". This provides an easy way to create a concept map and it can be used as well of systems thinking. The tools helps you create easy to understand maps easily.

Click here for a larger version of the map.
I am sure that this map makes better sense than before. Do let me know your thoughts on this.


6 Comments:
from whence these french/portuguese comments?
There is also another inexpensive software/tool for mapping - !nspiration, you can even download a free trial. I really like i;t we even created a 'map' for an IT grant and then roll it over right into a WORD document, where you can add the 'map' right into your research. I wish I had used this software for my masters action research project.
heh, do you mind sending me the template ( html code ) for your blog???
I have one of my own and i am thinking of 'upgrading it'.
Thanks!!!
waterdischarge@yahoo.com.sg
Dear Suhit
hope you got the flat ok? Try charity stores: Good Samaritans, or St.Vincent de Paul, Anglicare for cheap furniture and even curtains, linen etc. Not all the stuff people take to these places is old or even second hand. Australians are very wasteful people, I have picked up new linen in second hand stalls.Are you good at cooking? See if you can share a market stall somewhere in Adelaide and cook some yummy food from home, remember , what seems like ordinary supper for you, may well be exotic for us!
I haven't had a chance to look CMAP Tools, but it seems to be a static representation.
You might want to take a look at Stella (http://www.hps-inc.com/) to create a dynamic model of the yuan peg. A grphical representation allows you to layout the relationships graphically. Using parameters you can then see how the whole system responds to multiple changes.
Red-Jazz:
I did try word/powerpoint but what I found was that CMap is exclusively suited to make it easier to write while showing relationships and its easier to make the Map.
Dak:
I will be checking out the software you have suggested. yes dynamic mapping would greatly enhance the ability to forecast the inherent dynamic relationships.
Post a Comment
<< Home